Contact Us

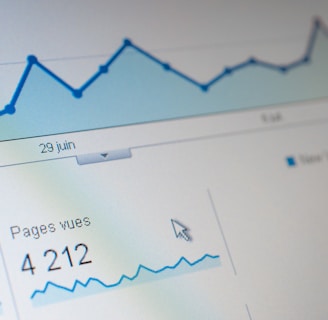
A computer screen displaying a data analytics dashboard with graphs and charts. A blue line graph shows fluctuations in data over time, and a section highlights the number of page views. A pie chart is partially visible, indicating a breakdown of different data elements.

Reach out to us to explore how AI can enhance your business growth and productivity today.

Contact Us

Reach out to us for inquiries about AI solutions that enhance growth, efficiency, and productivity for business professionals.

Location

123 Business Ave, Suite 456

Hours

9 AM - 5 PM